Game Changer in Target-Based Drug Discovery

A different way to monitor GPCR binding, target engagement and internalization with a new fluorescent-conjugate toolbox.
The past decade has witnessed fluorescently tagged drug molecules gaining significant attraction in their use as pharmacological tools with which to visualize and interrogate receptor targets at the single-cell level. One such drug-target family that has received considerable attention are the GPCRs. GPCRs are 7-transmembrane spanning receptors, which account for nearly 4% of the protein-encoding human genome (1) and are the target of approximately 30% of all marketed drugs (2). This key protein family regulates various intracellular biological cascades via the binding of extracellular endogenous ligands, such as peptides, hormones and neurotransmitters. There is significant interest surrounding the development of fluorescent ligands with which to study GPCRs.
Fluorescent ligands for GPCRs are composed of an agonist or antagonist that is chemically linked to a fluorescent molecule (3). Their design and synthesis require careful planning and execution in the selection of the correct fluorescent dye, linker length/composition and geographic attachment point to the drug scaffold. All these aspects can influence the ultimate selectivity and potency of the final conjugate when compared with its unlabeled precursor.

High-affinity fluorescent antagonists can be used to label the target GPCR, and fluorescently tagged agonists can provide a means to monitor dynamic processes such as receptor internalization and trafficking. The advantage to use a fluorescent ligand instead of a radioligand in a competition-based binding assay (4) offers the possibility not only to the inherent safety risks, legal issues and disposal costs associated with the latter but also to present an enormous potential for revealing elaborate and intricate details about biased agonism and receptor oligomerization (4).
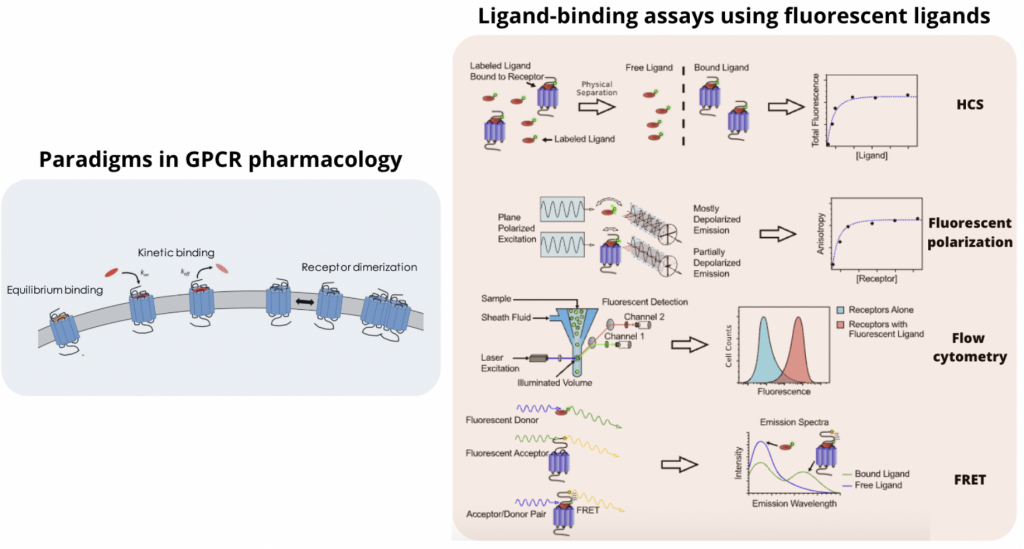
There are different ways in which these emerging tools have been used experimentally to probe GPCRs. In this review, we will focus the attention on three main GPCR paradigms (equilibrium binding, binding kinetics and allosteric modulation) and four different fluorescent assays (High Content Screening, Fluorescence Polarization, Flow Cytometry and FRET) used in GPCR Target-Based Drug Discovery.

Paradigms in GPCR pharmacology
a. Ligand binding Equilibrium
The first step in the identification of a new drug-like molecule for a GPCR is to determine its affinity for the receptor of interest. The most common approach used to estimate binding affinity is competition binding assay. In this experiment, the effect of increasing concentrations of a selected compound on the binding of a labelled compound is measured (7).
Although affinity binding is a fundamental step in target-based drug discovery, key factors that must be considered relating to fluorescence-based binding assays include the ability to distinguish bound from unbound ligand, the ability to distinguish specific from non-specific binding (or between different classes of binding sites present in the same preparation of receptors), and the ability to distinguish actual reversible binding from internalization of ligand into cells.
b. Ligand Binding Kinetic
Numerous clinically approved drugs have demonstrated a non-equilibrium mode of binding, remarking the importance that equilibrium affinity is not a sufficient parameter to determine the prediction of molecule’s in vivo efficacy. (8, 9, 10). A clear example of the importance of dynamic affinity was demonstrated in the treatment of chronic obstructive pulmonary disease, where compounds with slow constant of dissociation (koff) for the β2-adrenoceptor have been shown to have better clinical outcomes (11), whereas for the treatment of schizophrenia anti-psychotics with fast koff for D2 receptor, demonstrated to avoid long-term side effects (12). Multiple time points are essential to estimate kinetic rates, and in a radioligand-binding assay, a separate assay point is required for each time point. This can make them time consuming to perform and not well suited to high-throughput screening.
c. Ligand Allosteric modulation
One of the most important factors that influence the binding kinetics of a ligand to the receptor is the conformational state of the receptor. GPCRs exist in different conformational states, including inactive, intermediate, and active states, and the kinetics of ligand binding can vary depending on the state of the receptor. Ligands that bind to a GPCR on a topographically distinct site from the orthosteric ligand are termed allosteric modulators. The nature of the ligand and the presence of allosteric modulators can also affect the kinetics of ligand binding and elicit a conformational change in the receptor that modulates the binding of orthosteric ligands (13, 14).
Ligand-binding assays using fluorescent ligands
a. HCS
High content screening (HCS) is a powerful tool used in drug discovery and development to identify potential drug candidates. Fluorescent ligands can be used as replacements for radioligands in saturation or competitive ligand binding analyses in which physical means, such as filtration, or centrifugation (for cells or membranes) or affinity or size exclusion chromatography (for purified receptors) are used to separate free from bound ligand.
Celtarys fluorescent ligand CELT- 331 represents a good example of high-affinity agonist fluorescent ligands validated for HCS assays and designed specifically for human CB2 receptor.

b. Fluorescence polarization
Binding assays based on fluorescence polarization have been used to characterize the ligand binding properties of purified receptors and are particularly well-suited for use in high-throughput screening (15, 16). This technology is based on the fact that low molecular weight ligands undergo rapid rotational motion in solution, but are more restricted when bound to large receptors. Molecules that are illuminated with linearly-polarized light will emit with a defined polarization with respect to the incident beam if rigidly held in place, but the orientation of the polarization will be randomized if the molecule rotates significantly during the time span of the excited state of the fluorescent transition (17). As with other spectroscopic assays, anisotropy-based binding can be measured in equilibrium experiments, with no need to separate bound from unbound ligands and can be used to study the target molecule in its native state, without any modification. Measurements can be made using a fluorimeter or a fluorescence plate reader with polarization capabilities.
An example of Celtarys fluorescence ligand validated on Fluorescence Polarization, is CELT-228, an antagonist ligand generated to recognize with high affinity and selectivity A3 Adenosine receptor. This fluorescent ligand was tested in competition binding assay, using cell membrane extracts. The values obtained are comparable with those reported in the literature for several well-known A3R reference ligands as shown in Fig.n.4.

c. Flow Cytometry
Flow cytometry measures fluorescence only when a cell (or other particle) passes through the narrow fluid path of a flow cytometer, collecting emitted light only from a small volume surrounding the particle. This allows the determination of the amount of fluorescent ligand associated with cells in a homogeneous suspension with no need to physically separate free from bound ligand (19). The main advantage of this technique is that the assays can be conducted at very low cell densities, resulting in a low overall concentration of receptors, as needed for assaying interactions with low dissociation constants without complications introduced by ligand depletion. Moreover, ligand binding can be quantitated in either saturation or competition-type assays.
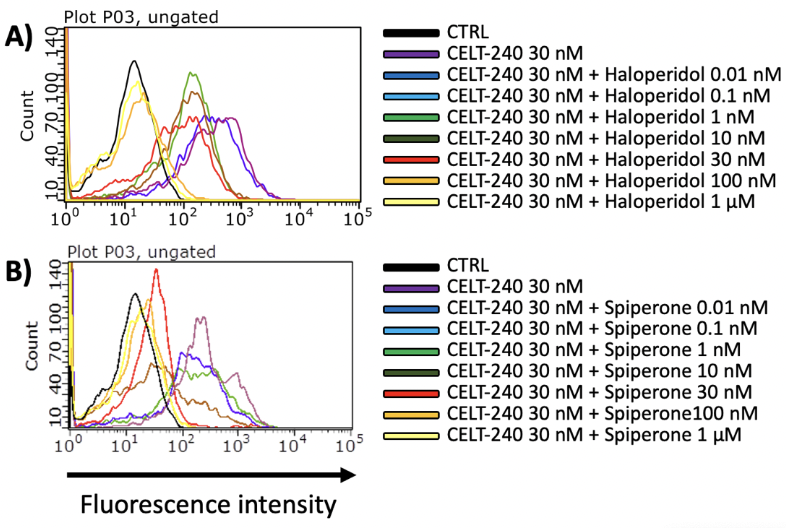
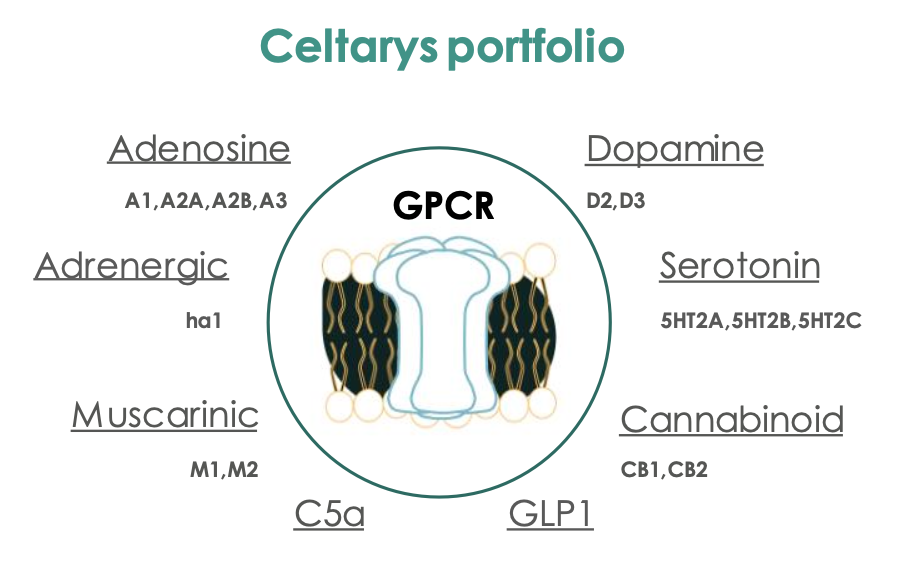
Among the extended Celtarys portfolio, CELT-240, a fluorescent ligand with high affinity for D2/D3 dopamine receptors, was validated in a competition binding assay on Flow cytometry. In fig.n.5 is shown the displacement of CELT-240 (30 nM) by growing concentration of Haloperidol in CHO-D2 cell line and Spiperone in CHO-D2 cell line.

d. FRET
In fluorescent based assays is it possible to quantify the direct measurement of fluorescence or indirect measurement using resonance energy transfer. This technique is commonly used to measure the interaction between two molecules labelled with two different fluorophores (the donor and the acceptor) by the transfer of energy from the excited donor to the acceptor (20). The presence of FRET can be detected either via enhanced emission of the longer wavelength (acceptor) fluorophore or via loss of emission from the shorter wavelength (donor). This technique has demonstrated to be more suited to high-throughput screening due to its higher signal-to-noise ratios and lower non-specific signal compared with direct fluorescence measurement-based methods (4). Moreover, high signal-to-noise ratios mean fluorescent ligands can be used at much higher concentrations than radioligands. Labelling of GPCRs for this type of assay can be accomplished by fusing fluorescent proteins to the extracellular N-terminal region of the receptors, by specifically attaching small fluorescent tags to the N-terminal of the receptor, or through binding of a fluorescently labelled antibody to the native N-terminal of a receptor or an epitope fused at this position.
At Celtarys we have generated a newly designed agonist fluorescent ligand for CB1 receptor, CELT-335, that was validated in a competition binding assay using a particular version of FRET, named Homogeneous Time Resolved Fluorescence (HTRF). This fluorescent probe was designed and validated to study similarities and differences upon binding of naturally occurring Δ9-tetrahydrocannabinol-derivatives to cannabinoid CB1 and CB2 receptors in competition experiments of binding of fluorophore-conjugated CELT-335 to living HEK-293 T cells expressing the CB1R. These results were recently published in the paper of Raïch L. et al (2021).

Know more about Celtarys
At Celtarys we count with more than 30 Fluorescent ligands validated in different applications (flow cytometry, fluorescence polarization, High Content Screening, HTRF, confocal microscopy), potent (Ki<100 nM) and subtype-selective (>100 fold), covering a wide range of the group A of GPCR families, with a large variety of fluorophores.

References
- Bjarnadottir, T. K., Gloriam, D. E., Hellstrand, S. H., Kristiansson, H.,Fredriksson, R., & Schioth, H. B. (2006). Comprehensive repertoire and phylogenetic analysis of the G protein-coupled receptors in human and mouse.Genomics,88(3), 263–273. https://doi.org/10.1016/j.ygeno.2006.04.001.
- Zhou, J., & Wild, C. (2019). GPCR drug discovery: emerging targets, novel approaches and future trends. Current topics in medicinal chemistry, 19(16), 1363.
- Vernall, A. J., Hill, S. J., & Kellam, B. (2014). The evolving small‐molecule fluorescent‐conjugate toolbox for Class A GPCRs. British journal of pharmacology, 171(5), 1073-1084.
- Cottet, M., Faklaris, O., Zwier, J. M., Trinquet, E., Pin, J. P., & Durroux, T. (2011). Original fluorescent ligand-based assays open new perspectives in G-protein coupled receptor drug screening. Pharmaceuticals, 4(1), 202-214.
- Soave, M., Briddon, S. J., Hill, S. J., & Stoddart, L. A. (2020). Fluorescent ligands: Bringing light to emerging GPCR paradigms. British Journal of Pharmacology, 177(5), 978-991.
- Sridharan, R., Zuber, J., Connelly, S. M., Mathew, E., & Dumont, M. E. (2014). Fluorescent approaches for understanding interactions of ligands with G protein coupled receptors. Biochimica et Biophysica Acta (BBA)-Biomembranes, 1838(1), 15-33.
- Hulme, E. C., & Trevethick, M. A. (2010). Ligand binding assays at equilibrium: validation and interpretation. British journal of pharmacology, 161(6), 1219-1237.
- Hothersall, J. D., Brown, A. J., Dale, I., & Rawlins, P. (2016). Can residence time offer a useful strategy to target agonist drugs for sustained GPCR responses?. Drug discovery today, 21(1), 90-96.
- Kola, I., & Landis, J. (2004). Can the pharmaceutical industry reduce attrition rates?. Nature reviews Drug discovery, 3(8), 711-716.
- Schuetz, D. A., de Witte, W. E. A., Wong, Y. C., Knasmueller, B., Richter, L., Kokh, D. B., … & Ecker, G. F. (2017). Kinetics for Drug Discovery: an industry-driven effort to target drug residence time. Drug Discovery Today, 22(6), 896-911.
- Beeh, K. M., Westerman, J., Kirsten, A. M., Hébert, J., Grönke, L., Hamilton, A., … & Derom, E. (2015). The 24-h lung-function profile of once-daily tiotropium and olodaterol fixed-dose combination in chronic obstructive pulmonary disease. Pulmonary pharmacology & therapeutics, 32, 53-59.
- Kapur, S., & Seeman, P. (2001). Does fast dissociation from the dopamine D2 receptor explain the action of atypical antipsychotics?: A new hypothesis. American Journal of Psychiatry, 158(3), 360-369.
- Kenakin, T., & Christopoulos, A. (2013). Signalling bias in new drug discovery: detection, quantification and therapeutic impact. Nature reviews Drug discovery, 12(3), 205-216.
- May, L. T., Leach, K., Sexton, P. M., & Christopoulos, A. (2007). Allosteric modulation of G protein–coupled receptors. Annu. Rev. Pharmacol. Toxicol., 47, 1-51.
- Moore, K. J., Turconi, S., Ashman, S., Ruediger, M., Haupts, U., Emerick, V., & Pope, A. J. (1999). Single molecule detection technologies in miniaturized high throughput screening: fluorescence correlation spectroscopy. SLAS Discovery, 4(6), 335-353.
- Banks, P., Gosselin, M., & Prystay, L. (2000). Fluorescence polarization assays for high throughput screening of G protein-coupled receptors. Journal of Biomolecular Screening, 5(3), 159-167.
- Sridharan, R., Zuber, J., Connelly, S. M., Mathew, E., & Dumont, M. E. (2014). Fluorescent approaches for understanding interactions of ligands with G protein coupled receptors. Biochimica et Biophysica Acta (BBA)-Biomembranes, 1838(1), 15-33.
- Sklar, L. A., Edwards, B. S., Graves, S. W., Nolan, J. P., & Prossnitz, E. R. (2002). Flow cytometric analysis of ligand-receptor interactions and molecular assemblies. Annual review of biophysics and biomolecular structure, 31(1), 97-119.
- Miranda-Pastoriza, D., Bernárdez, R., Azuaje, J., Prieto-Díaz, R., Majellaro, M., Tamhankar, A. V., … & Sotelo, E. (2022). Exploring Non-orthosteric Interactions with a Series of Potent and Selective A3 Antagonists. ACS Medicinal Chemistry Letters, 13(2), 243-249.
- Stoddart, L. A., White, C. W., Nguyen, K., Hill, S. J., & Pfleger, K. D. (2016). Fluorescence‐and bioluminescence‐based approaches to study GPCR ligand binding. British journal of pharmacology, 173(20), 3028-3037.


